Education & Numérique
50.6K views | +0 today
Follow
Education, outils numériques, TICE, littéracies numériques. Digital Literacies.
Curated by Terheck
Your new post is loading...

Click a Tag = Custom Magazine

Current selected tag: 'Infographics'. Clear
Scooped by Terheck
Scoop.it!

10 clés pour naviguer sur Internet en toute sécurité

10 clés pour naviguer sur Internet en toute sécurité | Education & Numérique | Scoop.it
Carmen Rodriguez, formatrice indépendante sur la thématique de l’information numérique, vient de créer et de mettre en ligne une infographie pédagogique pour une utilisation responsable et sécurisée de la navigation sur les réseaux : 10 clés pour naviguer sur Internet en toute sécurité.
No comment yet.
Rescooped by Terheck from Vie numérique à l'école
Scoop.it!

Twictée : 10 raisons pour se lancer

Twictée : 10 raisons pour se lancer | Education & Numérique | Scoop.it

Via Michèle Drechsler
No comment yet.
Scooped by Terheck
Scoop.it!

10 outils en ligne pour créer des infographies

10 outils en ligne pour créer des infographies | Education & Numérique | Scoop.it

Un dessin vaut mieux que de long discours. Le refrain est connu. Le développement  de l'usage des infographies dans la presse , dans les médias, dans l'édition ces dernières années est une tendance lourde.

CDI Collège Gabriel Rosset's curator insight, December 4, 2015 3:50 AM

Pour mieux mémoriser, mieux comprendre des informations, notamment statistiques ou géographiques rien de mieux qu’un diagramme, une cartographie ou un schéma explicatif. Rien de mieux qu’une bonne infographie.

GROUPE ISORE's curator insight, March 29, 2016 6:54 AM

Pour mieux mémoriser, mieux comprendre des informations, notamment statistiques ou géographiques rien de mieux qu’un diagramme, une cartographie ou un schéma explicatif. Rien de mieux qu’une bonne infographie.

MFQM Pays de la Loire's curator insight, April 1, 2016 4:57 AM

Pour mieux mémoriser, mieux comprendre des informations, notamment statistiques ou géographiques rien de mieux qu’un diagramme, une cartographie ou un schéma explicatif. Rien de mieux qu’une bonne infographie.

Rescooped by Terheck from Digital Delights - Digital Tribes
Scoop.it!

How do You Choose Good Online Sources?

How do You Choose Good Online Sources? | Education & Numérique | Scoop.it

"Students often ask how to determine which websites and articles are good sources to cite. My answer is always, “Well, what do you think?” Students need to be able to think on their own. So, if your student offers some questionable sources, ask, “Why did you choose that one?” Try to get the student to think about the who, what, why, and when of the article and website. Let the student use critical thinking to come to a valid conclusion. They might just have a good reason for using the source."


Via Ana Cristina Pratas
Terry Doherty's curator insight, March 24, 2015 3:19 PM

Yes! A guided "funnel" to help students look more critically at content online. It can't help but "spill over" to other areas beyond schoolwork, right?

Joyce Valenza's curator insight, March 26, 2015 12:05 PM

Mia MacMeekin's useful poster for student assessment of credibility

Sally Tilley's curator insight, March 26, 2015 6:13 PM

We need to continually reinforce these skills for our students to master this, thanks for sharing


Scooped by Terheck
Scoop.it!

Are College Students Really Obsessed With Technology?

Are College Students Really Obsessed With Technology? | Education & Numérique | Scoop.it
Not too long ago, I read a post written by a teacher that said “Our students get younger every year”.
No comment yet.
Rescooped by Terheck from Public Relations & Social Marketing Insight
Scoop.it!

How Much Data Is Generated On Twitter, Instagram, Vine, Tinder & WhatsApp Every Minute?

How Much Data Is Generated On Twitter, Instagram, Vine, Tinder & WhatsApp Every Minute? | Education & Numérique | Scoop.it

Here’s the thing: the internet never sleeps.


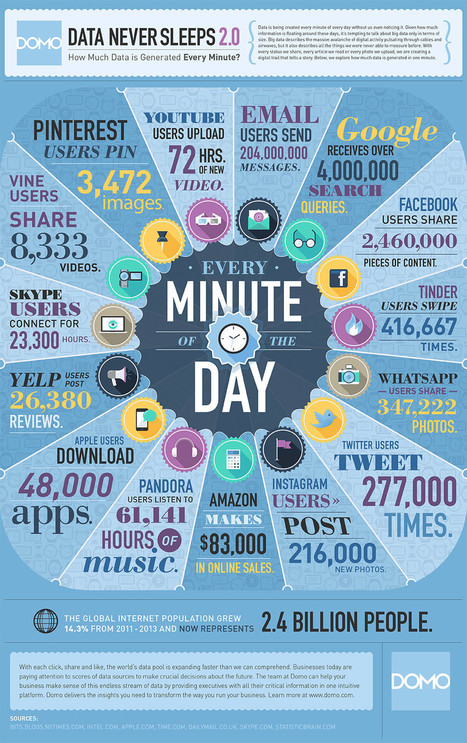
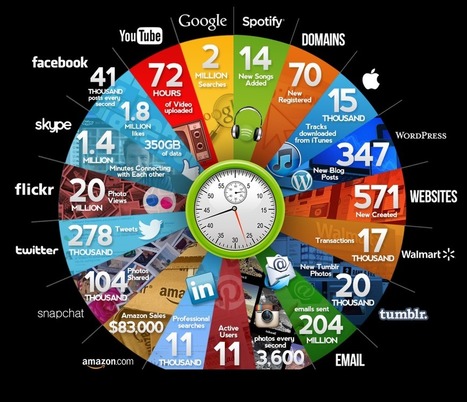
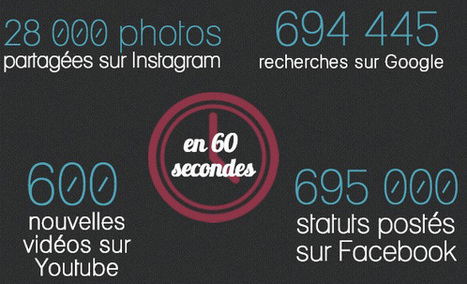
Which means data never sleeps, and the internet sure likes to use up a lot of it. How much? In any given minute, 277,000 tweets are published on Twitter, 216,000 photos are sent to Instagram and 8,333 videos are shared on Vine.


And we’re just getting started. Over that same 60 second period, 347,222 photos are sent on WhatsApp, 416,667 swipes are made on Tinder and 3,472 images are pinned on Pinterest.


And if you think that’s impressive, Google receives 4 millions search queries, Facebook users share 2.46 million pieces of content and 204 million email messages are sent each and every minute of the day.


This visual from DOMO looks at how much data is generated every minute across the net....


Via Jeff Domansky
Ignacio Garrido's curator insight, July 1, 2014 1:14 AM

Exercise 33. Remember you have to send the answer by Moodle. Good Luck¡¡


1. Write an opinion about avantatges and disavantatges of the nes technologies and in relation with the text.

2. What is the most used network in graphic?  Why do you think?

3. How many graph's apps do you know? How many do you use daily?

BI Media Specialists's curator insight, July 4, 2014 9:01 AM

Wow! This is mind boggling. 

Victor Juarez's curator insight, July 7, 2014 6:47 PM

¿Quién dice que las RRSS no tienen alcance?

Rescooped by Terheck from Information and digital literacy in education via the digital path
Scoop.it!

A Quick, No-Nonsense Guide to Basic Instructional Design Theory

A Quick, No-Nonsense Guide to Basic Instructional Design Theory | Education & Numérique | Scoop.it
Of the many eLearning theories that influence the practice, three of them are used by professionals on a daily basis.

Via Elizabeth E Charles
Tina Jameson's curator insight, June 19, 2014 11:33 PM

A nice visual of three predominantly observed theories of learning:
Cognitivism
Behaviourism
Constructivism 

José Antônio Carlos - O Professor Pepe's curator insight, June 20, 2014 7:21 AM

Ótimo infográfico com dicas sobre as três teorias de aprendizagem (construtivismo, behaviorismo e cognitivismo) mais comuns nos programas de design instrucional. Simples sem ser simplista.

Darleana McHenry's curator insight, June 26, 2014 9:19 AM

I love stuff like this. It makes me think about what I am doing and why :-)

Rescooped by Terheck from Digital Delights for Learners
Scoop.it!

Sprites - Create Infographics

Sprites - Create  Infographics | Education & Numérique | Scoop.it
Sprites is a free tool for creating beautiful animated infographics for the Web.

Via Ana Cristina Pratas
Raluca Luana Gaiseanu's curator insight, May 28, 2014 3:47 AM

Keep searching for a good free infographic tool, that will make my "life" easier. Today, Sprites is tested :) Brand new app, so let's criticize. :D

Amy Burns's curator insight, June 3, 2014 6:18 AM

Interesting variation on infographic creations.

Alfredo Corell's curator insight, June 4, 2014 5:55 PM
Easy to Use

With a good set of visual elements and built-in themes composing your infographic becomes super-easy.

Free and Open

The basic version of Sprites is absolutely free for everybody and all infographics are released under Creative Commons license.

Embracing the Web

Everything in Sprites is 100% HTML5-based and plugin-free. There's no Flash or any other proprietary technology used.

Fully Scalable

Sprites infographics utilize the newest responsive design techniques and should look good on pretty much any device.

Mobile-Ready

We try to make Sprites infographics shine on as many platforms as possible. You can already try it on your iPhone and iPad.

Developer-Friendly

The JavaScript SDK plus the guidelines on making your own themes are available atgithub.com/spritesapp.

Rescooped by Terheck from visualizing social media
Scoop.it!

Social Media Demographics: Who Uses What Platforms?

Social Media Demographics: Who Uses What Platforms? | Education & Numérique | Scoop.it

A massive survey of over 1,800 internet users reveals trends in social media usage across numerous platforms, ages, races, genders, population density and more.

All data derived from the Pew Research Center.


Via Lauren Moss
Lea Vainshtein's curator insight, May 6, 2014 3:16 PM

טבלאות מסכמות את התפלגות משתמשי רשתות חברתיות

המסכנה: אם את עד גיל 30, ממוצא דרום אמריקאי, עירונית, בעלת השכלה 

מאיזשהו קולג' ומשתכרת נמוך 

אז את הצרכנית העיקרית של פייסבוק חחח


Kim Bradley's curator insight, May 10, 2014 11:49 PM

Great facts on social media trends and usage amongst various demographics.  Social media is trending across all groups!

Juan Carlos Giraldo Cardozo's curator insight, August 31, 2014 1:47 PM

Estadísticas sobre quiénes usan las redes sociales

Scooped by Terheck
Scoop.it!

Réaliser une infographie : comment et avec quels outils ?

Quelques éléments de bon sens pour réaliser une infographie - Bonnes pratiques et outils -
Noël Uguen's curator insight, April 18, 2014 7:59 AM

dossier sur les créations d'Infographies

Scooped by Terheck
Scoop.it!

Pays par pays, quels sont les profils des internautes européens ?

Pays par pays, quels sont les profils des internautes européens ? | Education & Numérique | Scoop.it
Une étude d'AT Internet décrypte les différences d'usages du Web entre Français, Allemands, Anglais et Espagnols.
No comment yet.
Scooped by Terheck
Scoop.it!

Infographie : les 5,7 millions de Français accros aux réseaux sociaux

Infographie : les 5,7 millions de Français accros aux réseaux sociaux | Education & Numérique | Scoop.it
68% d'entre eux sont des cyber-acheteurs et 30% laissent des commentaires sur les produits ou services.
No comment yet.
Scooped by Terheck
Scoop.it!

The Busy Teacher’s Quick Guide To Blended Learning

The Busy Teacher’s Quick Guide To Blended Learning | Education & Numérique | Scoop.it

"Blended learning is a combination of some face-to-face teaching and some online teaching. It is a great way for teachers to bring online components into the forefront, rather than just using digital materials as supplemental (often at home) course materials. Blended learning has a huge advantage – it doesn’t prescribe that particular activities must be online or in person. There isn’t a particular percentage of teaching and learning that has to happen in the classroom or not. You can tailor it to your needs, and do some experimentation. It is so flexible, and can be something different for each teacher, each class, or each student..."

No comment yet.
Rescooped by Terheck from Educnum
Scoop.it!

22 infographies pour utiliser les technologies, apprendre et comprendre

22 infographies pour utiliser les technologies, apprendre et comprendre | Education & Numérique | Scoop.it
Voici un recensement d'infographies réalisées par Thierry Karsenti, professeur à l'Université de Montréal et titulaire de la Chaire de recherche du Canada sur les technologies de l'information et de la communication (TIC) en éducation. Ces infographies sont diffusées sur le site de Thierry Karsenti, dans la section Publications.

Via Michelle Laurissergues
No comment yet.
Rescooped by Terheck from Learning & Technology News
Scoop.it!

How to Evaluate Web Resources

How to Evaluate Web Resources | Education & Numérique | Scoop.it
Effective and credible writing requires authoritative and verifiable resources. Learn the best ways to evaluate sources of information on the Web.

Via Nik Peachey
Tatiana Kuzmina's curator insight, October 9, 2015 5:19 AM

Useful tool

delta14's curator insight, October 9, 2015 10:20 AM

Excelente guía para evaluar recursos web, frente a la gran cantidad de publicaciones y aportes que emergen en la RED.

Tina Jameson's curator insight, October 15, 2015 10:04 PM

So much information and so little time!  This infographic and webpage provide clear guidance that teachers can use to help their students be more selective about the sources they choose to use.  

Scooped by Terheck
Scoop.it!

Les chiffres 2015 de ce qui se passe chaque minute sur internet

Les chiffres 2015 de ce qui se passe chaque minute sur internet | Education & Numérique | Scoop.it

"Ce n’est un secret pour personne que de dire que les utilisateurs d’internet ont une grande préférence pour les réseaux sociaux.

Et ce nombre d'utilisateurs ne cesse de croître chaque année. Alors, évidemment, plus il y a d’utilisateurs, plus il y a d’interactions sur les réseaux sociaux qui recrutent chaque minute des milliers de nouveaux membres.

Comme vous le montre l’infographie ci-dessus, il se passe des choses sur internet. Ainsi, en 2015, chaque minute..."

CDMG GUADELOUPE's curator insight, May 12, 2015 2:43 PM

Effrayant !

Nick Truch's curator insight, May 13, 2015 5:22 AM

Excellente infographie !

Scooped by Terheck
Scoop.it!

How To Find Openly Licensed Educational Resources You Can Use

How To Find Openly Licensed Educational Resources You Can Use | Education & Numérique | Scoop.it
Most of us turn to the internet when we are looking for resources to use for a presentation, report or article. The internet holds the key to so many robust resources.

Yet how many of these resources can you legally use for free? How many of them can you adapt?

That’s where Open Educational Resources (OER) can help. Here’s an infographic from the Center for Open Educational Resources and Language Learning (at the University of Texas at Austin) that can help.
Suzanne's curator insight, February 17, 2015 5:02 AM

Every language teacher and student should contribute to make this a powerful resource concept. Language is an instrument; use it, take care of it, share it.

Dean Mantz's curator insight, February 18, 2015 11:15 AM

Thanks to @Dennis T OConnor for sharing this infographic on finding and identifying open source education resources.  

Iolanda Bueno de Camargo Cortelazzo's curator insight, February 19, 2015 12:00 PM

Bastante úteis estas informações para professores e gestores educacionais.

Rescooped by Terheck from visualizing social media
Scoop.it!

What & Why People Share On Social Media (Infographic)

What & Why People Share On Social Media (Infographic) | Education & Numérique | Scoop.it

What people are sharing and how they’re sharing it is changing fast. A new infographic from Go-Gulf, a web design team based in Dubai, has gathered the latest data, which is now available in this newly released (July 2014) social media infographic. Here are the highlights…


Via Lauren Moss
Raihan Roney's curator insight, September 23, 2014 12:51 AM
Raihan Roney
Rachel Turner Dool's curator insight, October 26, 2014 6:47 AM

Wow! what a list of stats. Some really interesting ones here...

CONETZAR's curator insight, October 30, 2014 6:21 AM

¿Alguna vez te has preguntad qué comparte la gente en las redes sociales? Y, ¿por qué lo comparte?

Esta interesante y completa infografía muestra los elementos más compartidos en las redes sociales durante el año 2013. Estos van desde vídeos hasta opiniones o noticias.

También se analiza lo compartido en las diferentes redes sociales y por qué se eligen esos medios para compartirlo.

Por último, es posible conocer los datos demográficos de los usuarios de redes sociales.


Para terminar... un dato curioso: Según este estudio, el país en el que más contenido se comparte a través de las redes sociales es Turquía, con un 93 %. 

Scooped by Terheck
Scoop.it!

15 infographies pour comprendre les enjeux du numérique

15 infographies pour comprendre les enjeux du numérique | Education & Numérique | Scoop.it

"Comment valoriser la culture numérique et faciliter la compréhension d’aspects du monde connecté en mode visuel ? Les étudiants en DUT Information et Communication (IUT de La Roche-sur-Yon) ont réalisé des infographies thématiques sur des points évoqués en cours de culture numérique (par Olivier Ertzscheid, Maître de Conférences en Sciences de l’information et de la communication). (...)"

No comment yet.
Scooped by Terheck
Scoop.it!

15 Essential Netiquette Guidelines to Share with Your Students

15 Essential Netiquette Guidelines to Share with Your Students | Education & Numérique | Scoop.it

"Netiquette ( net + etiquette) is the code of proper conduct applied to virtual online spaces. This code is dictated by common sense rules ( manners ) and social conventions. Teaching students about netiquette is just as important as teaching them to use technology in their learning. Crafting a netiquette memo for your class and informing your students about the importance of these rules will definitely help you create an engaging, respectful, and meaningful learning environment where collaboration and diversity of opinions are celebrated. (...)"

No comment yet.
Rescooped by Terheck from The 21st Century
Scoop.it!

This is What Happens Every Single Minute Online

This is What Happens Every Single Minute Online | Education & Numérique | Scoop.it

"Here is another visual with some mind-blowing stats about what happens every minute online. It is just unbelievable the speed with which this digital avalanche is moving and nobody can predict its destination..."


Via Dr. Susan Bainbridge
Melissa Cooper's curator insight, May 5, 2014 7:17 AM

Great data graphic about internet use

ANA's curator insight, May 5, 2014 9:45 AM

WOW!

Candice Blount's curator insight, June 8, 2014 7:45 PM

A visual representation on one minute on line.

Rescooped by Terheck from iGeneration - 21st Century Education (Pedagogy & Digital Innovation)
Scoop.it!

Google Tip and Tricks for Conducting Online Research Infographic

Google Tip and Tricks for Conducting Online Research Infographic | Education & Numérique | Scoop.it
At the Google Tip and Tricks for Conducting Online Research Infographic you will find crucial Google Tips and Tricks for conducting Online Research.

Via Tom D'Amico (@TDOttawa)
Sue Alexander's curator insight, April 20, 2014 3:07 PM

Yes, it is the world's longest infographic, but who could expect the research resources of Google to fit anywhere else? Good stuff!


Denise Lombardo's curator insight, April 21, 2014 9:49 PM

Some great tips and tricks here, even for younger students learning to refine their searches. 


carldowse's curator insight, May 27, 2014 4:17 AM

Very useful productivity tips for teachers and learners

Scooped by Terheck
Scoop.it!

1,000,000 people and businesses are now using Scoop.it!

1,000,000 people and businesses are now using Scoop.it! | Education & Numérique | Scoop.it
Interest-based content curation was only a vision 2 years ago when we launched: in a post Web 2.0 world, we felt that more and more we are the content we publish. Whether we liked it or not, we would all need to become media - a problem for busy professionals who don’t have time or inspiration for that and whose primary expertise is often not to be a content publisher.

Since then, publishing-by-curation rapidly turned into an important trend as 1,000,000 freelance professionals, community managers, content marketers, educators, knowledge managers, thought leaders, and more are now using Scoop.it to demonstrate and share their professional expertise, develop visibility for their small or mid-sized businesses or to make the company they work for smarter. Continue reading →
No comment yet.
Rescooped by Terheck from Digital Presentations in Education
Scoop.it!

Visme - Create Interactive Online Presentations

Visme - Create Interactive Online Presentations | Education & Numérique | Scoop.it
Easily Create online Presentations, animations, animated HTML5 banners, infographics and other rich visual content free in your browser. Visme is the perfect alternative to Flash and Powerpoint or keynote to create professional presentations, infographics, HTML5 banners and interactive content in HTML5.

Via Baiba Svenca
Alfredo Corell's curator insight, April 6, 2014 8:11 AM

A Nice tool to create infographics, animations, presentations, etc.. web based (called EWC presenter before)

Monica S Mcfeeters's curator insight, April 6, 2014 6:13 PM

This is a great presentation tool for any browser!

Darleana McHenry's curator insight, April 12, 2014 10:17 AM

This is an interesting site that I want to try.

Rescooped by Terheck from visualizing social media
Scoop.it!

Internet Consumption Around the World

Internet Consumption Around the World | Education & Numérique | Scoop.it

What do people do online in today’s world, how do they get online, and at what speeds? A new report from International Business Guide shows how how do millions of people in the world access the internet, where the internet is the fastest, and the devices with which they connected, following the first year when there are more mobile internet devices than humans.

View this infographic to see which regions lead the world in terms of internet access rates, who consumes what online and the most popular websites by region.


Via Lauren Moss
Arnaud d'Haen's curator insight, April 3, 2014 6:13 AM

You're consuming... right now!

Smith_Lin's curator insight, April 3, 2014 9:24 AM

This has to be useful on all sorts of levels

Ariel Harosh's curator insight, April 4, 2014 11:51 AM

השימוש באינטרנט ברחבי העולם נתונים מדהימים