


Research and publish the best content.
Get Started for FREE
Sign up with Facebook Sign up with X
I don't have a Facebook or a X account
Already have an account: Login

Digital Delights - Images & Design
471.3K views |
+8 today
Free tools to edit images, some cool photography & design
Curated by
Ana Cristina Pratas
 Your new post is loading...
 Your new post is loading...
Your new post is loading...
|


A large number of Wikipedia articles are geocoded. This means that when an article pertains to a location, its latitude and longitude are linked to the article. As you can imagine, this can be useful to generate insightful and eye-catching infographics. A while ago, a team at Oxford built this magnificent tool to illustrate the language boundaries in Wikipedia articles. This led me to wonder if it would be possible to extract the different topics in Wikipedia.
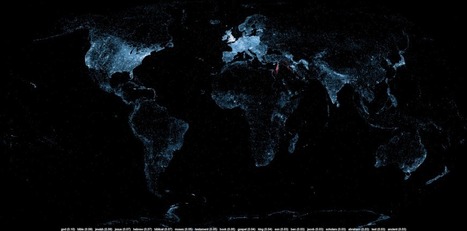
This is exactly what I managed to do in the past few days. I downloaded all of Wikipedia, extracted 300 different topics using a powerful clustering algorithm, projected all the geocoded articles on a map and highlighted the different clusters (or topics) in red. The results were much more interesting than I thought. For example, the map on the left shows all the articles related to mountains, peaks, summits, etc. in red on a blue base map. The highlighted articles from this topic match the main mountain ranges exactly.
Read on for more details, pretty pictures and slideshows.
A bit about the processYou can skip this section if you don’t really care about the nitty-gritty of the production of the maps. Scroll down to get to the slideshows.
Getting the dataTrains, stations, platforms, railways, etc.
The first the step to create these map was to retrieve all Wikipedia articles. There are 1.5 million of them and only a portion (400,000) are geocoded, but this doesn’t matter, because it’s an all or nothing deal: everything must be downloaded. I had to download the raw data from this page. It’s quite a large download at 9GB compressed and it expands to about 40GB once it is uncompressed. I then parsed this very large file to extract the article content, links and geographical coordinates.
Identifying topicsIslands, coasts, beaches, oceans, etc.
To extract topics from this huge corpus, I used Latent Dirichlet Allocation. This algorithm can extract a given number of topics from a large corpus. Usually the optimal number of topics can be inferred from the likelihood values over several topic runs. However, in this case, since the corpus is very large and each run is very time consuming (50 hours on the most powerful AWS cluster instance), I chose a number relying on an educated guess and my LDA experience.
I ran the LDA algorithm using Yahoo’s LDA implementation since it’s quite fast and can be parallelized. After 50 hours, I got 300 different topics linked to 1.5 million articles, but because only 400,000 of them are geocoded, the rest of this post only pertains to these 400,000. You can download the topic descriptions here. The topics are very varied and range from geographical regions, ethnic groups, science, sports (including both kinds of football!), historical sites and even archeological dig sites.