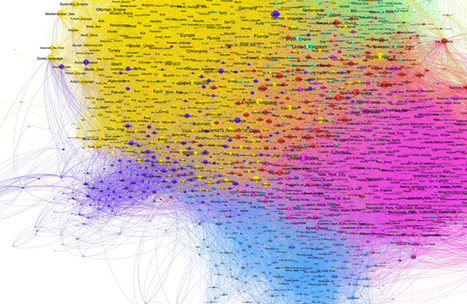
Not a web designer or developer? You may prefer free tools for creating infographics.
As author, data journalist and information designer David McCandless said in his TED talk: “By visualizing information, we turn it into a landscape that you can explore with your eyes, a sort of information map. And when you’re lost in information, an information map is kind of useful.”
There are many different ways of telling a story, but everything starts with an idea. So to help you get started we’ve rounded up some of the most awesome data visualization tools available on the web....
Via Jeff Domansky


 Your new post is loading...


Adressing the visula part of the learning brain with easy-to-use, web-dased tools
#data
Colorful charts/graphs/maps are my type of eye candy! This site illustrates the vast ways you can visually present data. Among the many: iChart, Polymaps, Google Charts, Many Eyes, Leaflet, Exhibit, and Zing Chart.