Design, Science and Technology
45.8K views | +0 today
Follow
Design, Science and Technology
#ideas #design #science #technology #inspiration #media #information
Your new post is loading...
Rescooped by Antonios Bouris from visual data
Scoop.it!

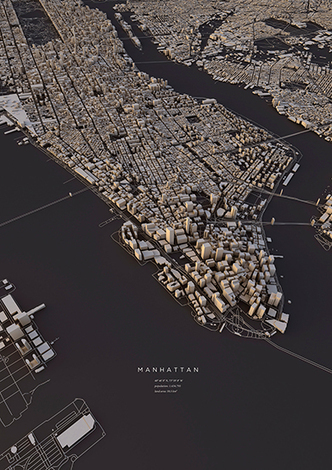
City Layouts Created with OpenStreetMap Data

City Layouts Created with OpenStreetMap Data | Design, Science and Technology | Scoop.it

Topography, architecture and traffic routes give every city a unique structure.
'These conditions create the typical and individual inner structure of a city. I didn’t only want to show these structures in the conventional way from above, but also including the exact three-dimensionality of topography and buildings – a real world visualisation.
The OpenStreetMap data enabled me to visualize the satellite-based information using DEM Earth in Cinema 4D. The results are some extraordinary views of large capitals and small towns.'


Via Lauren Moss
No comment yet.
Rescooped by Antonios Bouris from visual data
Scoop.it!

Subway Maps Of Cities Around The World Redesigned In A Circular Format

Subway Maps Of Cities Around The World Redesigned In A Circular Format | Design, Science and Technology | Scoop.it

Mapmaker Max Roberts has created a new way to map out subway lines.  Conventional maps usually emphasize “straight lines, clean angles and geographical accuracy”. Unlike those maps, Roberts’ circular design is a blend of “aesthetics and usability”. 

Roberts discovered this “completely new way of designing maps” when he was designing a map for the London Underground that took into account the circular nature of the Orbital rail link. He realized the potential of the new design in forcing “cities into an unprecedented level of organization” and the coherence achieved. Sacrificing geographical accuracy, his schematic design shows how elements in the map relate to each other logically, while taming the web of criss-crossed lines usually found in subway maps.

View maps of the New York City Subway, the London Underground and the Paris Metro at the article link, or head over to hiswebsite to see more circular maps of other cities. 


Via Lauren Moss
Niki Brown Beck's curator insight, December 5, 2014 9:44 PM

New perspective (transportation)

Rescooped by Antonios Bouris from visual data
Scoop.it!

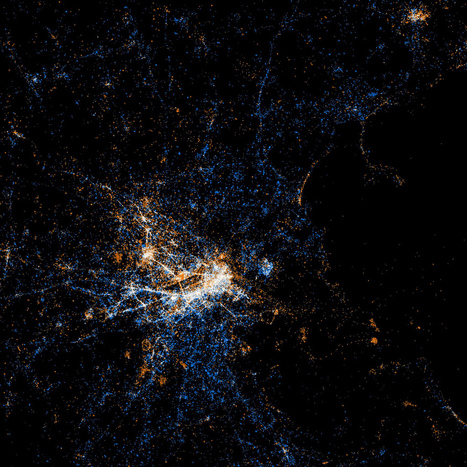
50 Maps Showing Where and What Happens in Cities Across the Globe

50 Maps Showing Where and What Happens in Cities Across the Globe | Design, Science and Technology | Scoop.it

“Where people post geotagged photos to Flickr from and geotagged tweets to Twitter from.” via Eric Fischer

Red dots are locations of Flickr pictures. Blue dots are locations of Twitter tweets. White dots are locations that have been posted to both. 


Via Lauren Moss
Patrice Mitrano's curator insight, February 4, 2014 8:51 AM

voir aussi la page Flickr d'Eric Fischer, l'auteur de ces images spectaculaires : http://www.flickr.com/photos/walkingsf/