Design, Science and Technology
45.8K views | +0 today
Follow
Design, Science and Technology
#ideas #design #science #technology #inspiration #media #information
Your new post is loading...
Rescooped by Antonios Bouris from green infographics
Scoop.it!

An Interactive Flood Tool to Calculate Climate Change Risks

An Interactive Flood Tool to Calculate Climate Change Risks | Design, Science and Technology | Scoop.it
A new interactive tool estimates the economic, urban, and demographic risks through 2030.

According to the World Resources Institute, river floods affect 21 million people in the world every year. In 2030, that number could rise to 54 million, with climate change driving the increase and urbanization putting more people in harm's way...


Via Lauren Moss
Judit Urquijo's curator insight, March 29, 2015 12:33 PM

Información útil

Descarga: web

Precio: gratuita

Idioma: inglés

Website del desarrollador: World Resources Institute


Descripción

El Aqueduct Global Flood Analyzer es una herramienta web interactiva diseñada para mostrar mediante modelos los daños de las inundaciones sobre los entornos urbanos, el PIB y la población, pudiendo consultar esta información tanto desde el punto de vista de la nación, la cuenca hidrográfica o el estado.


Una vez seleccionado el ámbito, la aplicación permite seleccionar el nivel de protección contra inundaciones medido en años, que hace referencia a los tipos de sistemas construidos para prevenir las inundaciones y que normalmente suelen estar dimensionados en función de los períodos de retorno.


En base a los citados criterios, la herramienta presenta los costes generados por las inundaciones en base a datos de 2010. La aplicación también permite a los usuarios estimar el riesgo futuro, realizando proyecciones en el contexto de tres escenarios climático y socioeconómicos distintos.  


Más información

http://www.citylab.com/weather/2015/03/calculating-the-cost-of-river-floods-in-an-age-of-climate-change/387154/

http://floods.wri.org/#/

http://www.wri.org/resources/maps/aqueduct-global-flood-analyzer

Rescooped by Antonios Bouris from green infographics
Scoop.it!

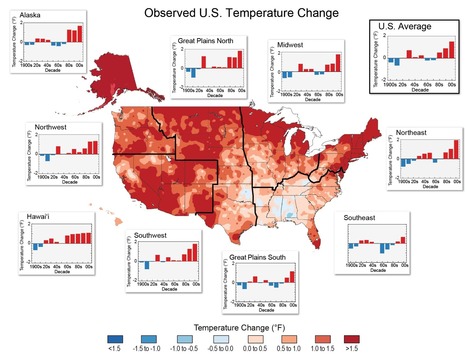
Nine maps that show how climate change is already affecting the US

Nine maps that show how climate change is already affecting the US | Design, Science and Technology | Scoop.it

Climate change isn't just a problem for future generations — it's already affecting broad swaths of the United States.

That's the upshot of the National Climate Assessment, a massive new US government report detailing the current and future impacts of global warming around the country. The report is particularly useful in detailing how specific regions and sectors will be affected — and outlining some possible ways we could adapt.

There's a lot of information in the report, but find nine highlights at the link.


Via Lauren Moss
No comment yet.
Rescooped by Antonios Bouris from green infographics
Scoop.it!

Milton Glaser designs campaign to tackle climate change

Milton Glaser designs campaign to tackle climate change | Design, Science and Technology | Scoop.it

Milton Glaser, the graphic designer behind the ubiquitous I heart NY logo, has launched a campaign to raise awareness of climate change.


Glaser's It's Not Warming, It's Dying campaign aims to create a greater sense of urgency around climate change, moving away from benign language like "global warming".


Via Lauren Moss
No comment yet.