

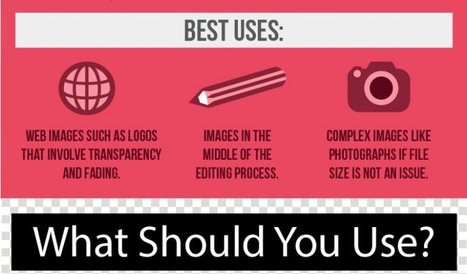

File types are a bit confusing to most people. Do you know when and why it's best to use a .jpeg, .gif, or .png? This infographic demystify the mystery.
Via Deb Nystrom, REVELN, Mark E. Deschaine, PhD, Dean J. Fusto
Get Started for FREE
Sign up with Facebook Sign up with X
I don't have a Facebook or a X account


 Your new post is loading...
 Your new post is loading...
Your new post is loading...
File types are a bit confusing to most people. Do you know when and why it's best to use a .jpeg, .gif, or .png? This infographic demystify the mystery. Via Deb Nystrom, REVELN, Mark E. Deschaine, PhD, Dean J. Fusto 
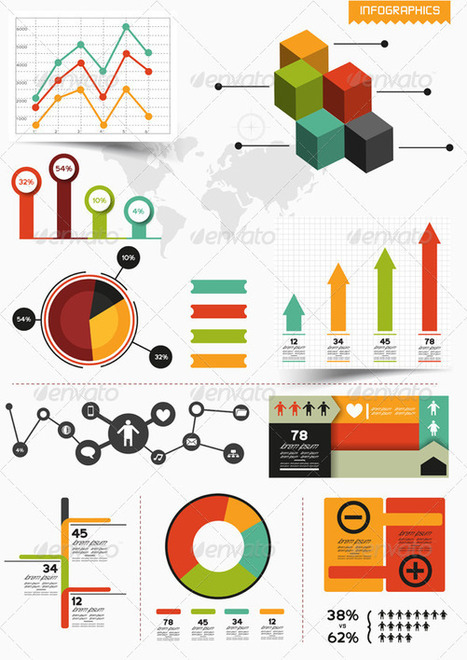
Information graphics or infographics are graphic visual representations of information, data or knowledge intended to present complex information quickly and clearly. The process of creating infographics can be referred to as data visualization, information design, or information architecture. In newspapers, infographics are commonly used to show the weather, maps, site plans, charts and graphs for statistical data.
These infographic element kits are all editable vector shapes in organized file formats, for use in presentation, print files or web site graphics. Via Lauren Moss
|


As my colleague, a graphic designer says, we aren't all graphic designers. How to "Know Your File Types" ~ Deb