Into the Driver's Seat
454.0K views | +15 today
Follow
Into the Driver's Seat
Building learners' independence through thoughtful technology use
Curated by Jim Lerman
Your new post is loading...
Rescooped by Jim Lerman from Cultivating Creativity
Scoop.it!

Some good iPad apps for showcasing students' learning

Some good iPad apps for showcasing students' learning | Into the Driver's Seat | Scoop.it

"One of the best ways to show students that their work is valuable and important is through displaying it in public. Showcasing students work has several benefits: knowing that their hard work is going to be recognized and shared with others, students push the envelope and invest more of their skills and efforts into it ..."

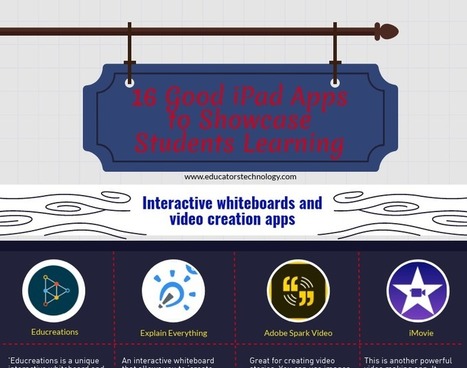
  1. Interactive whiteboards and video creation apps
  2. Apps for creating web pages, boards, and docs
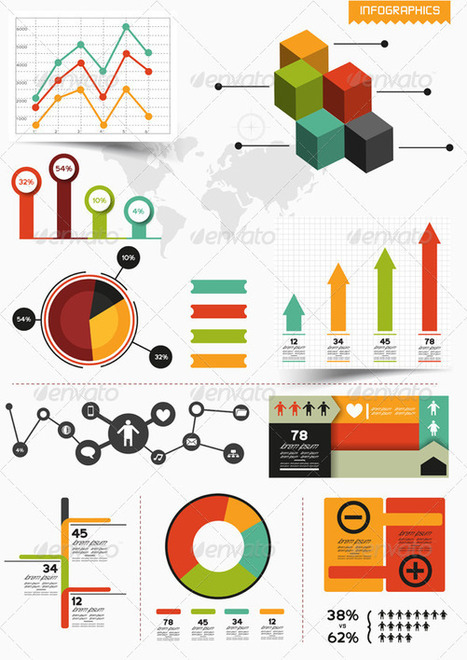
  3. Making graphics, posters and photo collages
  4. Digital portfolio apps

Via Leona Ungerer, Jim Lerman
No comment yet.
Rescooped by Jim Lerman from visual data
Scoop.it!

Dazzling Infographics Design Elements: Vector Resources

Dazzling Infographics Design Elements: Vector Resources | Into the Driver's Seat | Scoop.it

Information graphics or infographics are graphic visual representations of information, data or knowledge intended to present complex information quickly and clearly.

The process of creating infographics can be referred to as data visualization, information design, or information architecture. In newspapers, infographics are commonly used to show the weather, maps, site plans, charts and graphs for statistical data.


These infographic element kits are all editable vector shapes in organized file formats, for use in presentation, print files or web site graphics.


Via Lauren Moss
No comment yet.
Rescooped by Jim Lerman from Digital Presentations in Education
Scoop.it!

How to Create Killer Pinterest Graphics with PowerPoint

Looking for an easy and inexpensive way to add high quality graphics to your blog posts? You can do it in 10 steps with PowerPoint!

Via Baiba Svenca
Harsha Monga's curator insight, April 19, 2013 9:20 AM

How to make attractive PPTs for Cheap 

ManufacturingStories's curator insight, April 27, 2013 2:47 PM

Very well done slide presentation.

Mayra.Loves.Books's curator insight, May 5, 2013 7:56 PM

I've got to try this!

Scooped by Jim Lerman
Scoop.it!

26+ Pinterest Tools and Tips to Enhance Your Pinning Experience

26+ Pinterest Tools and Tips to Enhance Your Pinning Experience | Into the Driver's Seat | Scoop.it
I'm not saying tools are a must but if used properly, social media apps can be great enhancers to your social networking endeavors, especially one that involves images and graphics like Pinterest.
@aguennoune's curator insight, February 24, 2013 2:58 AM

Awsome!

Junita Lyon's curator insight, February 26, 2013 8:45 AM

Pinterest is great for the visual learner

Ness Crouch's curator insight, March 2, 2013 9:48 PM

I use Pinterest a lot for both work and pleasure. I love how I can organise what I find according to pictures! Try it if you haven't already.

Rescooped by Jim Lerman from iGeneration - 21st Century Education (Pedagogy & Digital Innovation)
Scoop.it!

Five Things You and Your Students Can Make With Canva by @rmbyrne

Five Things You and Your Students Can Make With Canva by @rmbyrne | Into the Driver's Seat | Scoop.it
During the weekend I received an email from a reader who was looking for advice on host to make a logo or graphic for her class and t

Via Tom D'Amico (@TDOttawa)
Kelley Cammack's curator insight, June 8, 2018 9:28 AM
Share your insight
Rescooped by Jim Lerman from visual data
Scoop.it!

Dazzling Infographics Design Elements: Vector Resources

Dazzling Infographics Design Elements: Vector Resources | Into the Driver's Seat | Scoop.it

Information graphics or infographics are graphic visual representations of information, data or knowledge intended to present complex information quickly and clearly.

The process of creating infographics can be referred to as data visualization, information design, or information architecture. In newspapers, infographics are commonly used to show the weather, maps, site plans, charts and graphs for statistical data.


These infographic element kits are all editable vector shapes in organized file formats, for use in presentation, print files or web site graphics.


Via Lauren Moss
No comment yet.
Rescooped by Jim Lerman from visual data
Scoop.it!

Vintage Data Visualization: 35 examples from before the Digital Era

Vintage Data Visualization: 35 examples from before the Digital Era | Into the Driver's Seat | Scoop.it

Graphics, charts, diagrams and visual data representations have been published on books, newspapers and magazines since they've existed, not to mention old maps and scientific illustrations...


Despite the lack of tools such as the ones we have at our disposal nowadays, they are as inspiring and important as the best contemporary visualizations. Visit the article link for a gallery of vintage visualizations...


Via Lauren Moss
Mariana Soffer's comment, July 20, 2013 9:39 AM
my pleasure
Charlley Luz's curator insight, July 20, 2013 10:26 AM

muito legal, os Infográficos antes de existir a internet. 35 exemplos de infográficos no papel :) Achei falta do Marcha para Moscou do Minard http://www.datavis.ca/gallery/re-minard.php ;

Leoncio Lopez-Ocon's curator insight, July 20, 2013 2:57 PM

El brasileño Tiago Veloso, fundador de Visual Loop, nos ofrece 35 interesantísimas representaciones visuales de distintos fenómenos y eventos que permiten hacer un paseo por la historia de la ilustración científica.

Rescooped by Jim Lerman from visual data
Scoop.it!

50 Well-Designed Infographics About Design

50 Well-Designed Infographics About Design | Into the Driver's Seat | Scoop.it

Here are another roughly 6,000 words of design facts, figures, and information contained in an article of only 600 words. In other words, this article is bigger on the inside than it is on the outside.

Alas, it’s still too small to contain all the well-designed infographics about graphic design, web design, photography, freelancing, and, of course, infographic design.


Each thumbnail links to the full-sized graphic on its original Website. For your convenience we’ve made each of those links pop open in a new tab or window. To return here, simply close that tab or window.


Via Lauren Moss
Jay Stevens's comment, March 9, 2013 6:44 PM
this one is packed with so much useful stuff—thanks!