


Get our free online math tools for graphing, geometry, 3D, and more!
Via Tom D'Amico (@TDOttawa) , Gwen Hilliard
Get Started for FREE
Sign up with Facebook Sign up with X
I don't have a Facebook or a X account


 Your new post is loading...
 Your new post is loading...
Your new post is loading...
Get our free online math tools for graphing, geometry, 3D, and more! Via Tom D'Amico (@TDOttawa) , Gwen Hilliard 
No comment yet.
Sign up to comment
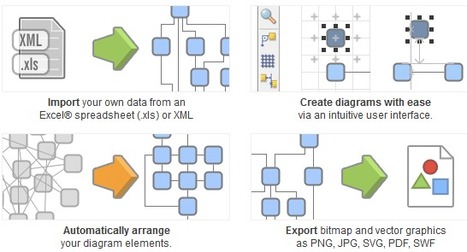
yEd is a powerful desktop application that can be used to quickly and effectively generate high-quality diagrams. Create diagrams manually, or import your external data for analysis. Our automatic layout algorithms arrange even large data sets with just the press of a button. Via Baiba Svenca

Baiba Svenca's curator insight,
August 8, 2013 2:28 PM
yED software is free to download, it works on all platforms and helps you create beautiful diagrams using ready-to-use elements. Import your data, including from Excel, and export your diagrams in a wide range of graphics formats. 
Marie-Chantal SCHMITZ's curator insight,
August 27, 2013 9:00 AM
Pour les professeurs ou les élèves qui souhaitent agrémenter leurs documents de graphiques soignés
Registration required, free to use. -JL
Robin Good: This has got to be a dream come true.
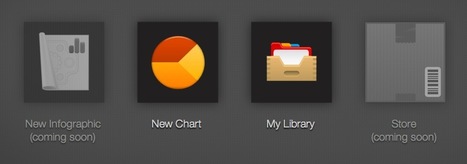
Create professionally-looking interactive graph charts (and soon also full infographics) with the best tool and easiest interface available out there.
Infogr.am makes it as easy as it can possibly be the creation of charts that will always look great and effective no matter what your design skill level is.
You simply choose the type of graph you want (bar, line, pie, matrix) to create, edit the existing data with your own, and you are ready to go.
Each chart is designed following some basic information design principles, allowing data to be easily read and for the chart to look very credible and "professional".
Infogram integrates an online library where to save your completed work, and an upcoming online store.
Awesome. 10/10 Via Robin Good
|
yEd is a powerful desktop application that can be used to quickly and effectively generate high-quality diagrams. Create diagrams manually, or import your external data for analysis. Our automatic layout algorithms arrange even large data sets with just the press of a button. Via Baiba Svenca
Baiba Svenca's curator insight,
August 8, 2013 2:28 PM
yED software is free to download, it works on all platforms and helps you create beautiful diagrams using ready-to-use elements. Import your data, including from Excel, and export your diagrams in a wide range of graphics formats.
Marie-Chantal SCHMITZ's curator insight,
August 27, 2013 9:00 AM
Pour les professeurs ou les élèves qui souhaitent agrémenter leurs documents de graphiques soignés

Polychart is a free web service that lets you easily create Dashboards and charts from your existing database. It conveniently connects directly to where you store your data and works in browsers and on tablets so you can create charts and diagrams anywhere you are. You can also export your charts to PowerPoint, PDF and image formats. Via Baiba Svenca
Baiba Svenca's curator insight,
June 21, 2013 4:21 PM
Read the review of Polychart which is a tool that lets you create and customize charts from your own data. Export your charts to PowerPoint, download as image or PDF. Watch the demo video that explains how to use Polychart https://www.polychart.com/ 
Lynn M. Miller's curator insight,
June 22, 2013 12:15 PM
Great article! *Professionalism with a Flair! #lmallc 
Wayne Turner's curator insight,
June 23, 2013 11:08 AM
I'm always looking for ways to graphically present complex information. |


