Into the Driver's Seat
454.4K views | +21 today
Follow
Into the Driver's Seat
Building learners' independence through thoughtful technology use
Curated by Jim Lerman
Your new post is loading...
Rescooped by Jim Lerman from visual data
Scoop.it!

Dazzling Infographics Design Elements: Vector Resources

Dazzling Infographics Design Elements: Vector Resources | Into the Driver's Seat | Scoop.it

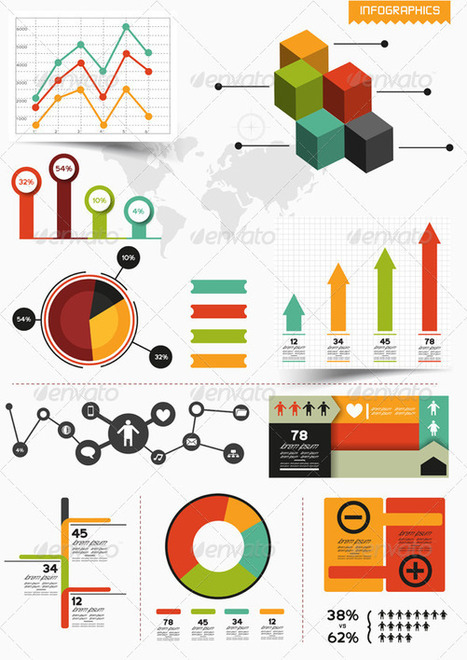
Information graphics or infographics are graphic visual representations of information, data or knowledge intended to present complex information quickly and clearly.

The process of creating infographics can be referred to as data visualization, information design, or information architecture. In newspapers, infographics are commonly used to show the weather, maps, site plans, charts and graphs for statistical data.


These infographic element kits are all editable vector shapes in organized file formats, for use in presentation, print files or web site graphics.


Via Lauren Moss
No comment yet.
Rescooped by Jim Lerman from visual data
Scoop.it!

Visual Design: Understanding Color Theory and the Color Wheel

Visual Design: Understanding Color Theory and the Color Wheel | Into the Driver's Seat | Scoop.it

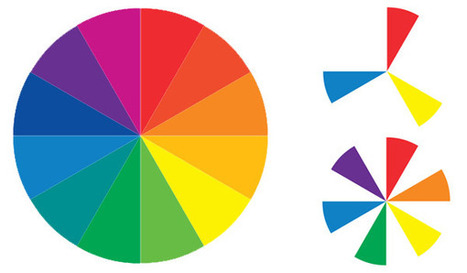
Sometimes the toughest step in building a new website or redesign can be the conceptual ones. Selecting a color palette is one of them that can be tough if you don’t have the right tools. So where do you start?


It all comes down to basic color theory and the color wheel. That same tool that teachers used in school really is the basis for how designers plan and use color in almost every project from the simplest web page to expansive brands with multiple sites and campaigns...


Via Lauren Moss
No comment yet.
Rescooped by Jim Lerman from visual data
Scoop.it!

Dazzling Infographics Design Elements: Vector Resources

Dazzling Infographics Design Elements: Vector Resources | Into the Driver's Seat | Scoop.it

Information graphics or infographics are graphic visual representations of information, data or knowledge intended to present complex information quickly and clearly.

The process of creating infographics can be referred to as data visualization, information design, or information architecture. In newspapers, infographics are commonly used to show the weather, maps, site plans, charts and graphs for statistical data.


These infographic element kits are all editable vector shapes in organized file formats, for use in presentation, print files or web site graphics.


Via Lauren Moss
No comment yet.