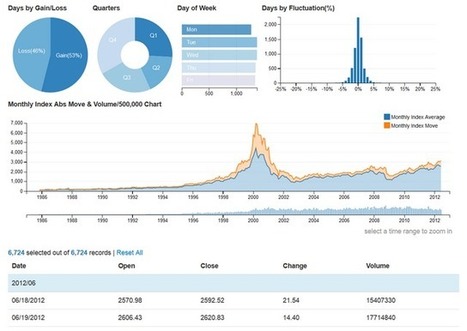

Dc.js is a JavaScript library used to make interactive dashboards in JavaScript. By clicking and selecting different events in graphs, you can filter the entire dashboard to drill into a particular event.
In order to do this, DC.js relies on two other JavaScript plugins/libraries: D3.js and Crossfilter js.
With this first art we're going to start off with how Crossfilter works because most of the actual dashboard code is manipulating the data for the charts. Once you have a good understanding of how that works, the actual graphing is pretty simple. I'm going to try to cover several different scenarios, so you can hopefully avoid some of the pitfalls as you start to use it.


 Your new post is loading...