KILUVU
137.2K views | +3 today
Follow
KILUVU
Pour partager le Monde Vu et Lu de mes yeux verts
Your new post is loading...
Rescooped by Yves Carmeille "Libre passeur" from Information and digital literacy in education via the digital path
Scoop.it!

From Bricks to Clicks – Learning Analytics recommendations

From Bricks to Clicks – Learning Analytics recommendations | KILUVU | Scoop.it
At the start of this year the UK Higher Education Academy (HEA) released its report ‘from bricks to clicks‘ which included (on p.7, copied below) a set of recommendations. Some of these are pretty UK specific (there may be Australian comparisons), but others are more general.

When it was released I thought it might be interesting for us to consider how UTS was addressing the recommendations (particularly as, per recommendation 8 and 9, my department falls within a strategic investment into university data adoption).  Actually looking through, the bullets, I did have immediate responses to each, but there are key recommendations I think are more interesting, and that I think would need implementing as pre-requisites to other recommendations (e.g., data literacy should be built before any use of data in accountability structures).  I might come back to this.

Via Elizabeth E Charles
No comment yet.
Rescooped by Yves Carmeille "Libre passeur" from Eclectic Technology
Scoop.it!

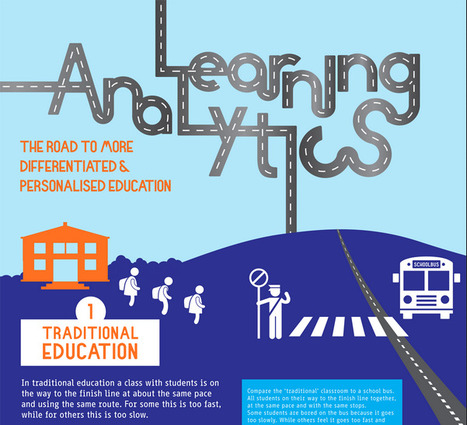
What is Learning Analytics? – Infographic

What is Learning Analytics? – Infographic | KILUVU | Scoop.it

"Learning Analytics is the measurement, collection, analysis and reporting of data about learners and their contexts, for purposes of understanding and optimizing learning and the environments in which it occurs."


Via Beth Dichter
Beth Dichter's curator insight, July 18, 2014 11:05 PM

This detailed infographic provides an in-depth look at learning analytics. It begins by describing traditional education as a school bus, with the expectation that all students will get to "the finish line together."

The infographic then turns to personalized learning, where students would work at their pace and in their way to master material.

Analytics play a key role in personalized education. Why? If you use a tool that provides you with the ability to measure, collect, analyze and report data about your students you have the opportunity to adapt curriculum. The infographic shares seven areas that may be considered.

From here the infographic moves to the learning analytics cycle which moves to four areas:

* Descriptive - What has happened?

* Diagnostic - Why has it happened?

* Predictive - What will happen?

* Prescriptive - What should I do?

What comes next? The role of the teacher, which is followed by a What's Next section.

There is much to learn about learning analytics in this infographic. You may download the complete infographic from the site.

miguel a. rodriguez's curator insight, July 19, 2014 5:24 AM

Interesante infografia  de google analytics

John Lemos Forman's curator insight, July 20, 2014 10:55 PM

Muita expectativa mas ainda poucos resultados concretos ... De qualquer modo, esta se formando uma percepção de que o modelo educacional vai ser fortemente impactado nos próximos anos

Rescooped by Yves Carmeille "Libre passeur" from Educational Leadership
Scoop.it!

Universities are tracking their students. Is it clever or creepy?

Universities are tracking their students. Is it clever or creepy? | KILUVU | Scoop.it
Learning analytics are becoming increasingly popular for improving learning and cutting drop-out rates – but critics question the impact on privacy

Via Peter Mellow
No comment yet.