


![[Infographic] Facebook Ad Performance by Industry | MarketingHits | Scoop.it](https://img.scoop.it/VS_hVUCVjs1Zhn8PbVSq-zl72eJkfbmt4t8yenImKBVvK0kTmF0xjctABnaLJIm9)

Ever wonder if your Facebook ads are performing better or worse than the industry standard for ROI – searching for some Facebook benchmarking data? What is the average CPM, CTR, CPC, the average cost per like, or average page like rate for your industry or business?
This graphic is based on data from Social.com’s study of 1 million ad units and over 114 billion impressions from January 1st to March 31st, 2013. The report analyzed the top 25 countries globally and top five countries per region based on impressions. All rates were converted to U.S. dollars using the average daily conversion rates during the reporting period.
You can use this data in many different ways – one of which is determining ROI of your Facebook Campaign to determine if social media is worth the ROI for your business.
Via Lauren Moss

 Your new post is loading...


![4 Ways Brands Can Gain Awareness on Clubhouse [+Examples] | MarketingHits | Scoop.it](https://img.scoop.it/iVKz7NcT0DX1ioauBbz7DDl72eJkfbmt4t8yenImKBVvK0kTmF0xjctABnaLJIm9)


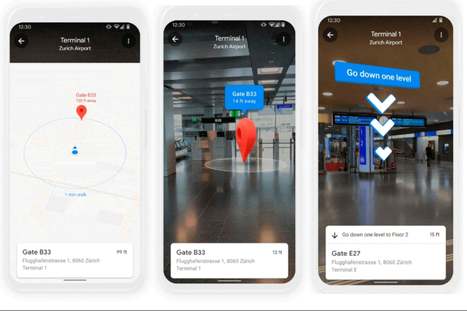


Facebook Ad Performance By Industry
How your ads rank on Facebook could have countless other reasons why it performs better or worse, ie - timing, image quality, messaging, target market, etc. Test on a relative basis with multiple ads.
Here is a great source of metrics for your next social media campaign