Ukr-Content-Curator
14.3K views | +0 today
Follow
Ukr-Content-Curator
Материалы о курировании содержания
Your new post is loading...
Rescooped by Vladimir Kukharenko from visual data
Scoop.it!

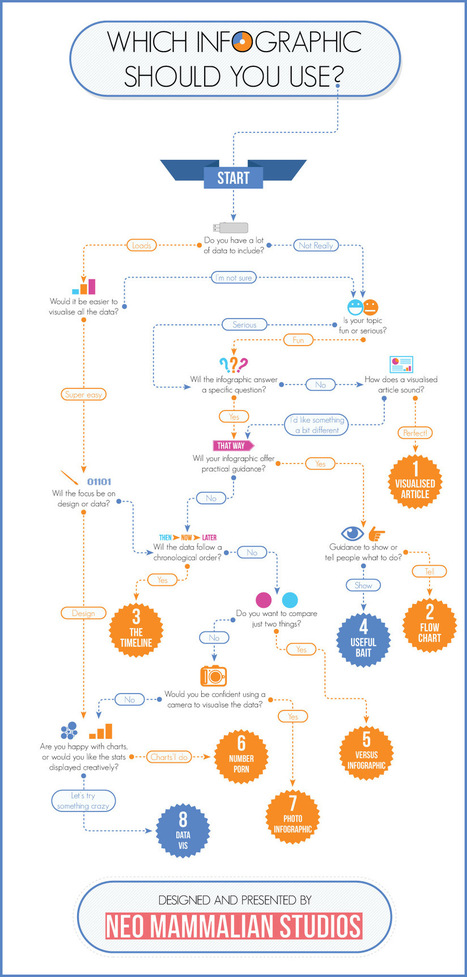
Which infographic is right for you?

Which infographic is right for you? | Ukr-Content-Curator | Scoop.it

That’s right, there’s more to infographics than a scrolling image full of facts and figures. Different types of infographics are consumed differently.

The right kind of infographic should match your data to your narrative and ensure that people take away your message after reading it.

While infographics may not come in that many shapes or sizes (600 x 1,800 pixels is the norm), that doesn’t mean there’s a stock standard infographic for you.  

Use the flowchart to help you decide which infographic is right for you...


Via Lauren Moss
No comment yet.
Rescooped by Vladimir Kukharenko from visual data
Scoop.it!

A Guide to Infographic Elements

A Guide to Infographic Elements | Ukr-Content-Curator | Scoop.it

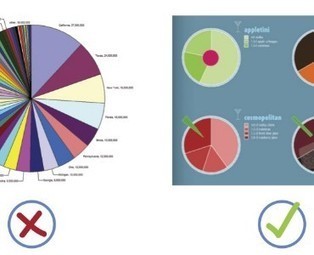
When it comes to visualizing data, it’s important to pick the right graph and the right kind of data range. Make it too detailed, and information gets lost and the reader leaves confused. Too simplified, and your data’s integrity is weakened.


Choosing the right infographic element shouldn’t be an art but common sense. After all, it’s an infographic – readers should get the gist of things at first glance and not have to get crossed-eyed in making sense of things...


Via Lauren Moss
Lauren Moss's curator insight, April 10, 2013 6:55 AM

General reference for basic visualization design elements, applications, and best practices...