Education 2.0 & 3.0
148.6K views | +3 today
Follow
Education 2.0 & 3.0
All about learning and technology
Curated by Yashy Tohsaku
Your new post is loading...
Rescooped by Yashy Tohsaku from TIC & Educación
Scoop.it!

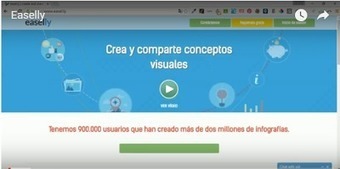
Easelly, otra opción para crear infografías

Easelly, otra opción para  crear infografías | Education 2.0 & 3.0 | Scoop.it
Hoy quiero recordar una herramienta de la que ya he hablado en este blog, pero de la que, todavía, no tenía editado ningún vídeo.
 
Me refiero a Easelly, una opción muy sencilla y versátil a la hora de crear infografías.
 
Yo utilizaría esta herramienta siempre que no fuera a necesitar gráficos procedentes de unos datos en una hoja de cálculo ya que,  como explico en el vídeo tutorial,  para eso existe otras opciones más recomendables.

Via Gumersindo Fernández
La pluma digital's curator insight, November 28, 2016 5:18 AM
Una forma sencilla de crear una infografía.
InsideOut's curator insight, November 28, 2016 10:48 AM
Cada vez son más usadas. Las infografías son algo visual que ayuda a los usuarios a entender cuestiones que no comprenden. Esta herramienta hace que la creación de las mismas sea más amena. 
Rescooped by Yashy Tohsaku from Information and digital literacy in education via the digital path
Scoop.it!

Can We Trust Copy Alone? 15 Visual Content Tools That Rock

Can We Trust Copy Alone? 15 Visual Content Tools That Rock | Education 2.0 & 3.0 | Scoop.it
Today I'm sharing just why it's dangerous to put your trust in copy on it's own and why visual content can create the perfect balance for your blog.

Via Elizabeth E Charles
No comment yet.
Rescooped by Yashy Tohsaku from TIC & Educación
Scoop.it!

Easily Add Charts to Infographics With Easelly

Easily Add Charts to Infographics With Easelly | Education 2.0 & 3.0 | Scoop.it
Easel.ly is an online tool for creating infographics. I've reviewed a couple of times in the past on this blog. The latest update to Easelly introduced a tool for creating charts to incorporate into your infographics. The chart creation tool is a drag-and-drop option that can be found in the Easelly toolbar.

Via Gumersindo Fernández
No comment yet.